This function plots a cross-section of a (trapezoid, rectangle, triangle), shaded as filled to the level indicated by the values passed to it.
Usage
xc_trap(y = NULL, b = NULL, m = NULL, units = c("SI", "Eng"))Examples
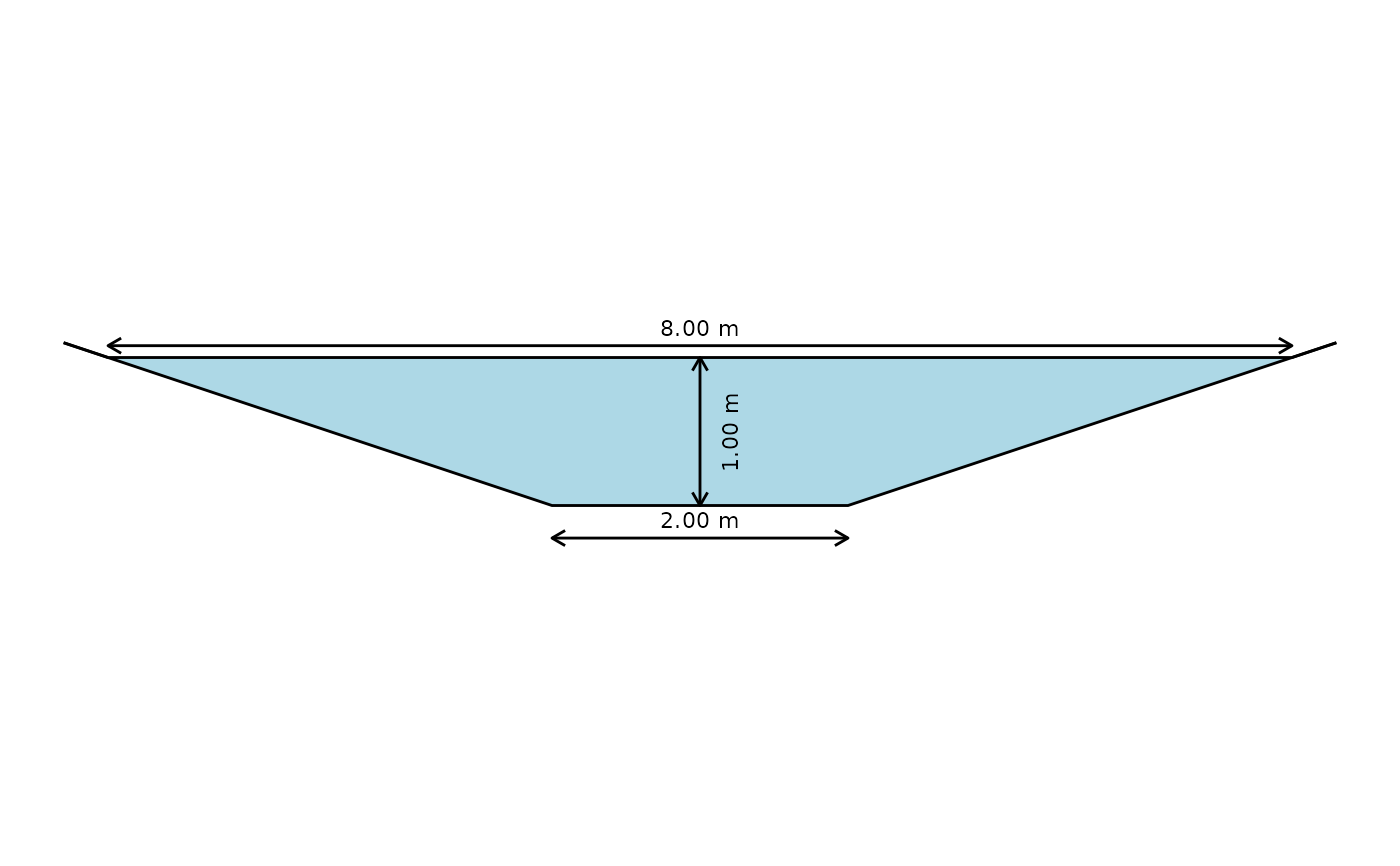
# Draw a cross-section with depth 1, width 2, side slope 3:1 (H:V)
xc_trap(y = 1.0, b = 2.0, m = 3.0, units = "SI")
#> Warning: All aesthetics have length 1, but the data has 2 rows.
#> ℹ Please consider using `annotate()` or provide this layer with data containing
#>   a single row.
#> Warning: All aesthetics have length 1, but the data has 2 rows.
#> ℹ Please consider using `annotate()` or provide this layer with data containing
#>   a single row.