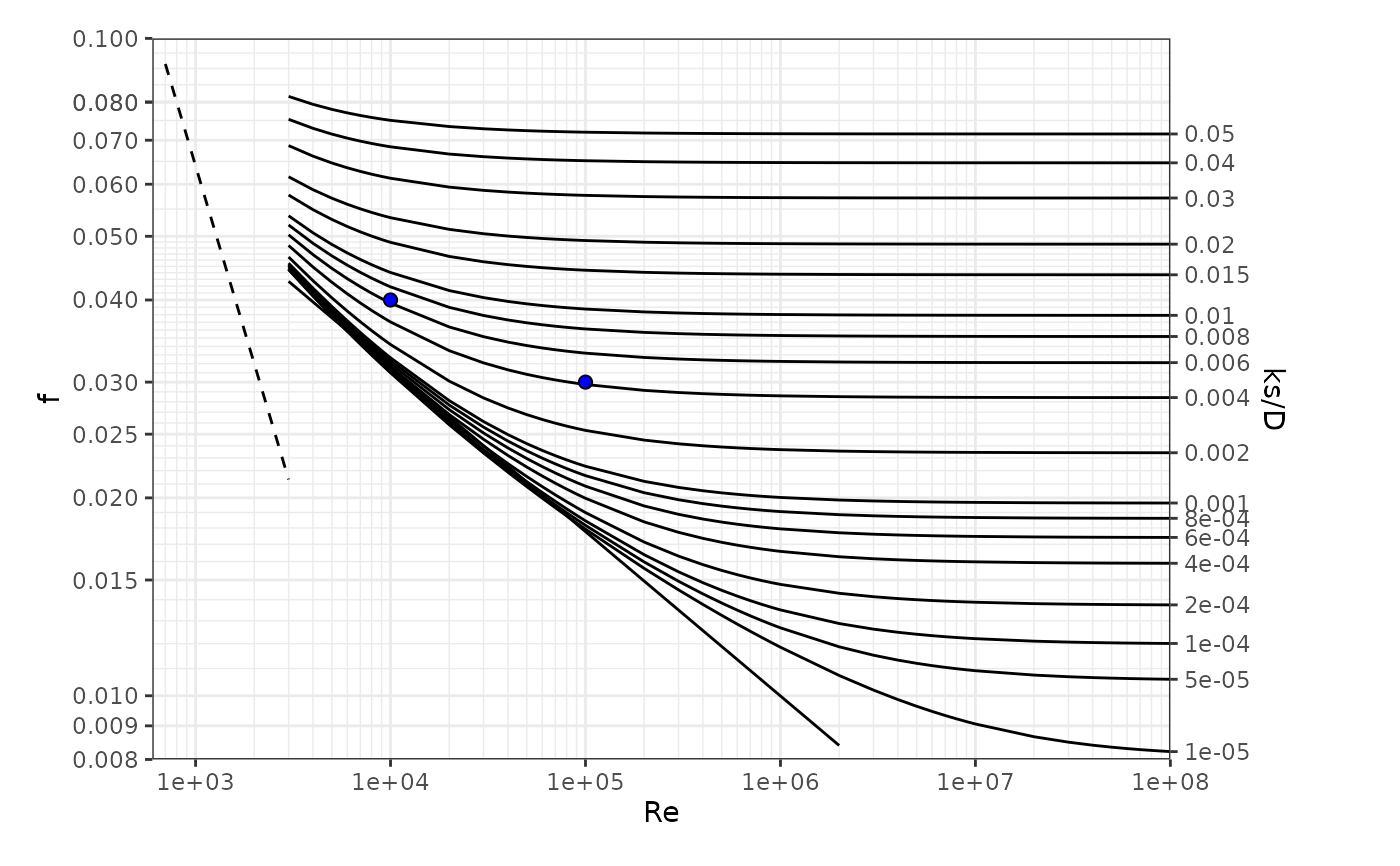
This function plots a standard Moody diagram, and allows additional
points to be added by including arguments Re and f.
Usage
moody(Re = NULL, f = NULL)
Arguments
- Re
(optional) numeric vector that contains the Reynolds numbers of points to be
manually added
- f
(optional) numeric vector (same length as Re) that contains the Darcy-Weisbach
friction factors corresponding to the points to be manually added
Value
a Moody diagram, with the optional added (Re, f) points
Examples
# Draw canonical Moody diagram
moody()

# Draw Moody diagram plotting two additional points
Re = c(10000, 100000)
f = c(0.04, 0.03)
moody( Re = Re, f = f )